Your cart is currently empty!


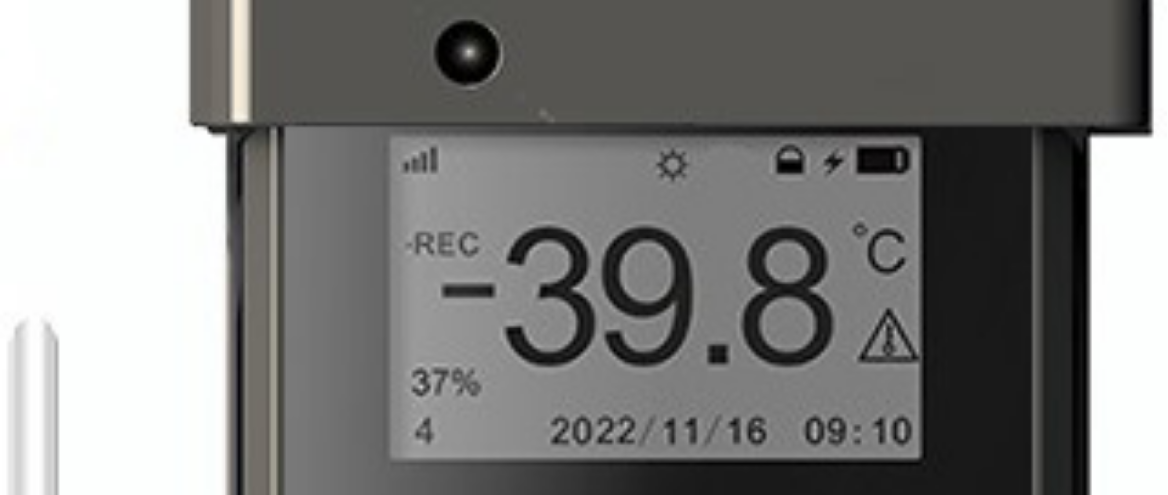
The goal of this blog is to explain a clear explanation of the way Hot Spot and Cold Spot Mapping is used, why it matters for pharmaceutical storage, and the ways Temperature Mapping Services can help teams to assess the temperature distribution in warehouses and cold rooms.
A pharmaceutical storage room can show an acceptable temperature on its routine monitoring device while another part of the same room is warmer or colder. Hot Spot and Cold Spot Mapping for Cold Chain Monitoring helps reveal these differences by measuring temperature across multiple locations within the storage area.
This matters because medicines, vaccines, biologics, and other temperature-sensitive products must remain within their specified storage conditions. WHO states that temperature mapping is used to establish temperature distribution in storage areas and locate hot and cold spots.
Did you know?
The WHO’s temperature mapping guide applies to cold rooms, freezer rooms, and dry stores, as well as to refrigerators and freezers, and the 2026 mapping tool offers continued support for the storage and mapping of pharmaceuticals.
This guide explains the concept of Temperature Mapping, how to identify cold and hot spots, when to perform Warehouse Temperature Mapping, Cold Room Temperature Mapping, and how to perform Thermal Mapping Validation to help you select the optimal storage options.
Temperature Mapping involves assessing the distribution of temperatures and the presence of cold and hot spots in a space by recording and mapping temperatures in three-dimensional spaces such as cold rooms, freezer rooms, or dry stores, refrigerators, and freezers. WHO states that temperature mapping and monitoring are essential to ensure proper pharmaceutical storage.
| Area | What mapping helps assess |
|---|---|
| Pharmaceutical warehouse | Temperature distribution across storage zones |
| Cold room | Warmer and colder locations |
| Refrigerator/freezer | Temperature behavior at different points |
| Dry store | Temperature differences by height and location |
The key point is simple: temperature monitoring tells you what is happening at selected points, while mapping helps you assess the wider storage area.
Given the nature of temperature-sensitive items such as medicines, vaccines, and clinical trial materials, stability of the temperature within a defined area is of utmost importance. If part of a room moves outside the required range, products stored in that area may need further assessment.
WHO states that, in some cases, different locations within a storage area may differ in temperature. The guidance identifies corners, locations near cooling units, and locations near doors as some areas where temperature may differ.
For a pharmaceutical team, this information can help answer practical questions:
A sound Temperature Mapping study starts with a clear protocol. The dimensions, doors, and shelves of the storage area, the cooling units, and the operating conditions and risk zones must all be included.
After the development of the protocol, data loggers must be strategically placed. WHO states specific methods for placing the sensors and recommends considering the risk zones when selecting the sensor locations.
The basic process is:
WHO’s mapping guidance describes a study period of at least 48 hours for its specific methodology, with the final approach depending on the equipment, facility, and study requirements.
Hot and cold spots are not always where you expect them to be.
A hot spot may occur near doors, areas with weaker airflow, or locations affected by external heat. A cold spot may occur close to cooling fans or strong cold-air paths.
Storage height can also matter. WHO notes that temperatures near the ceiling in dry stores tend to be higher than those near the floor.
Here’s a practical example: if your routine sensor sits near the center of a cold room, it may show an acceptable reading. A mapping study may still show a warmer zone near the door or a colder zone close to the cooling unit. That result gives your QA team information that one fixed sensor cannot provide.
Warehouse Temperature Mapping is recommended if a new facility is being commissioned, after major changes to the HVAC system or storage layout, after repairs, or when there is concern due to temperature excursions.
Cold Room Temperature Mapping is relevant for areas where temperature-sensitive products such as vaccines, biologics, and other similar products may be stored.
WHO states that mapping hot spots and cold spots can help prioritize areas of concern in temperature-controlled storage units and other areas that require corrective actions.
A professional Temperature Mapping Services provider can help plan the study, select appropriate monitoring locations, collect temperature data, analyze results, and prepare documentation.
Tempnote provides Cold Chain Validation and Thermal Mapping services for temperature-sensitive goods and offers consultation for cold rooms and reefer vehicles. Its website states that its thermal mapping work identifies temperature variations and generates temperature profiles for controlled environments.
For pharmaceutical facilities, look for a provider that can demonstrate suitable equipment, calibration, clear procedures, reliable data handling, and useful reporting.
Good pharmaceutical storage is not only about seeing an acceptable number on a screen. You also need to understand how temperature behaves throughout the storage area.
Hot Spot and Cold Spot Mapping gives your team that wider view. By identifying temperature variations, you can make better choices about monitoring locations, storage practices, and corrective actions.
If you need help assessing a pharmaceutical warehouse, cold room, or other controlled storage area, Tempnote can discuss your Temperature Mapping and Thermal Mapping Validation requirements and help you determine the appropriate next step.
Hot spot and cold spot mapping is a study used to determine the relatively warm and cold locations within a controlled storage environment. This mapping study is used to determine the temperature distribution within a controlled storage environment.
When performing temperature mapping, you can identify if the temperature is distributed appropriately throughout the storage area. It can identify potential problem spots that may require compensatory action or additional monitoring.
Maps identify temperature across multiple locations. Monitored temperatures are sampled during normal operation.
These can be located near doors, cooling units, corners, and areas with uneven air movement patterns. These could be determined by mapping, not by guesses.
Temperature mapping may be needed as part of a qualification of a facility or as part of a larger change in the facility. The frequency should be based on the result of the risk assessment and any other applicable requirements.